Scientific visualization with ParaView
Abstract: ParaView is an open source, multi-platform data analysis and visualization tool designed to run on a variety of hardware from an individual laptop to large supercomputers. With ParaView users can interactively visualize 2D and 3D datasets defined on structured, adaptive and unstructured meshes or particles, animate these datasets in time, and manipulate them with a variety of filters. ParaView supports both interactive (GUI) and scripted (including offscreen) visualization, and is an easy and fun tool to learn.
The first half of this workshop will cover some intermediate and advanced topics in 3D scientific visualization with ParaView including (1) scripting, (2) animation, and (3) remote and distributed visualization. In the second half participants will apply their newly gained knowledge of making animations on different datasets including one from a CFD simulation of a tidal turbine.
Instructor: Alex Razoumov
Workshop materials
The slides for Day 1 of this workshop (slides2.pdf) are included into the main ZIP file (~30 MB), along with sample datasets and various scripts.
Prerequisites
Please install ParaView 6.0.x from https://www.paraview.org/download on your computer before the workshop.
We expect participants to be somewhat familiar with the basics of ParaView: loading local datasets, interacting with their visualizations via the GUI, applying filters, and constructing basic visualization pipelines. We ask participants with no prior experience in ParaView to watch the following videos before attending the workshop:
- Running ParaView (11 min)
- File formats and reading raw binary (7 min)
- VTK file formats: overview and legacy VTK (13 min)
- VTK file formats: XML VTK (4 min)
- Scientific file formats (5 min)
- ParaView filters (11 min)
- Store your visualization workflow with a state file (2 min)
- Side-by-side visualization (3 min)
- Visualizing vectors (6 min)
- Creating better streamlines (3 min)
- Line integral convolution (LIC) (3 min)
- Reading CSV data (6 min)
- Putting your visualization online with ParaView Glance (5 min)
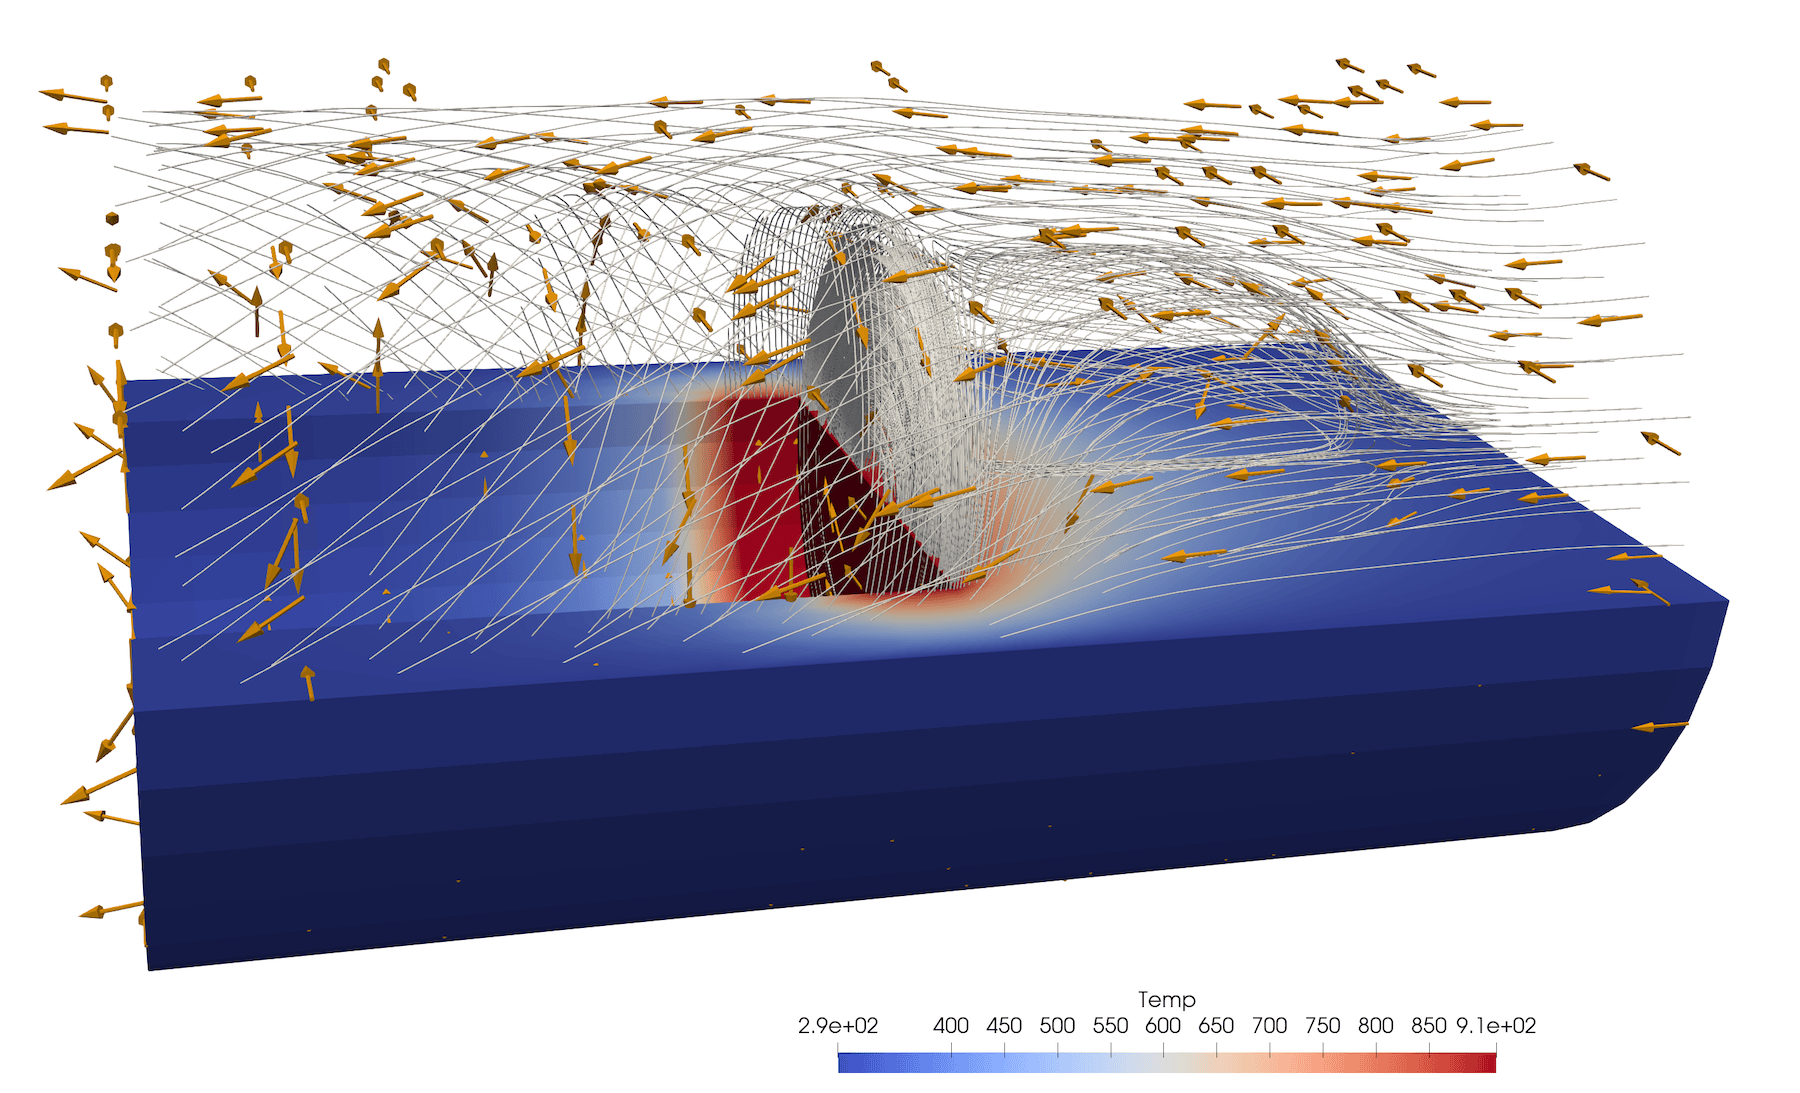
Quick knowledge test – before studying the workshop materials
Start ParaView on your computer, load the dataset data/disk_out_ref.ex2 and try to visualize temperature with a Clip and the velocity field with Stream Tracer With Custom Source and Glyph as shown in this image below:
Remote visualization
For remote visualization, if you already have a CC account, you can use it today, and we have also prepared guest accounts on Cedar – please pick an account and add your name to the line in the Goodle Doc (shared in Zoom chat) so that no one else uses it. If you already have a CC account, please add your username to the same Google Doc so that we could add you to the reservation.
We have two reservations on Cedar until 2021-10-05T23:59:00 (Pacific):
- 10-node CPU reservation
--account=def-training-wa_cpu --reservation=paraview-wr_cpu - 2-node GPU reservation
--account=def-training-wa_gpu --reservation=paraview-wr_gpu
Steps for partitioning the unstructured dataset
- Load all
m114f105_AL_2d_tsr_5_*.vtufiles located in/project/6052247/fbaratchi/paraview_training/unstructuredfolder on Cedar - Apply Cell Data to Point Data.
- Apply D3 filter.
- Save data as
A_NAME.PVTU“decomposed”, write all timesteps as series, use fast compression.
NOTE: Resulting partitioned data are located in /project/6052247/fbaratchi/paraview_training/partitioned on Cedar.